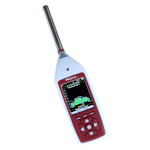
The Quantifier 1/3 Octave Band Sound Level Meter is provided with the Analyzer software, which has the following main features:
The sound level meter connects to the computer using the cable supplied. The Analyzer software will display all the measurements that are currently stored in the meter's memory.
You can select the noise measurements to download or opt to download them all. The measurements can be stored in separate folders to help to organise your work.
Once downloaded, the noise measurements are displayed in both a tabular and graphical format. The numerical values for the measurement are listed down the left side and include the time, date, duration and measurement range along with the Time and Frequency Weightings used for each parameter.
For broadband measurements the Time History graph is shown on the right side. A zoom function is provided to allow more detail to be shown on the graph. For Octave and 1/3 Octave Band measurements a graph of the noise level in each frequency band is displayed.
A number of standard reports are included with the software to satisfy most noise measurement requirements. These include simple tabular or graphical reports of the measurements as well as special reports for various occupational and environmental monitoring applications.
Reports can be sent directly to a printer or they can be sent to PDF or word processor files for storage or for emailing to colleagues.
The measurements can be exported in many formats. In particular, the tabular data can be sent to Excel or Word format for further analysis or inclusion in reports. If the standard reports that are built into Analyzer do not satisfy your needs then the export option gives all the flexibility that you need.